
Copenhagen is brilliant in walking and cycling.
But not all cities can learn from Copenhagen.
Overly focusing on one “star” city is not heathy for the field.
The success story is much broader, and some less known examples may be more relevant for your cities.
Global understanding had been impossible for a long while: scarce, fragmented and inconsistent data on walking and cycling particularly in the Global South.
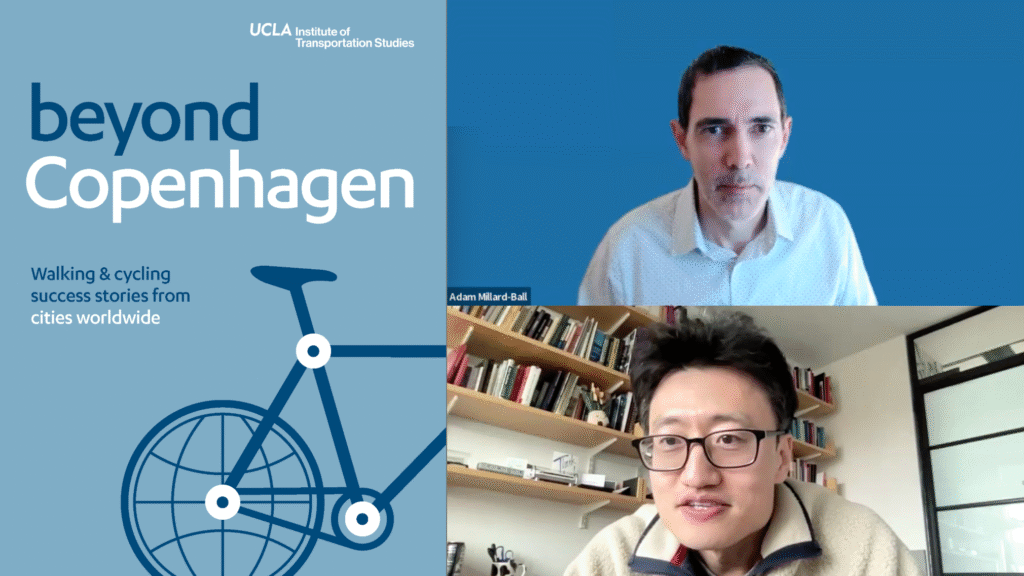
Yesterday I hosted Professor Adam Millard-Ball at the Mobility Forum #159 who utilized a globally consistent data set of more than 11,000 cities to tell a much richer story.
Key Messages from Adam Millard-Ball
1. Active Travel Matters at Scale
Investment in walking and cycling can meaningfully cut global emissions.
2. Walking First
While biking “gets more press,” walking actually matters more globally.
Walking: ~2.0% of total distance travelled
Cycling: ~0.9% of distance travelled traveled
3. Data Source and Method
Google Environmental Insights Explorer (EIE): a globally consistent dataset covering 11,587 cities from 121 countries, coving 41% of the world’s urban population
Distance share, not trip share: distance better maps to congestion, pollution, and safety.
Method: a Bayesian hierarchical model
Results: associational and not causal
4. Recipe for Success
• Density has the largest explanatory power, positively impacting both walking and cycling.
A one-standard deviation increase in the natural log of density is associated with a ~1.3 percentage point increase in the share of travel by walking in the median country.
The effect of density is significantly greater in high-income countries like Germany, Japan, and the U.S..
Where travelers have choices beyond economic necessity, urban form is more important.
In lower-income places like India or Nigeria, walking is driven by “financial constraints and concerns around safety.”
• Bicycle lanes help with both walking and cycling.
It is a proxy for a wider set of street design practices that benefit pedestrians, such as sidewalks, safe crossings, and traffic calming measures.
One new km of bicycle lane is associated with ~13,400 extra km of annual bicycle travel in the median city,
• Flatter terrain strongly supports cycling; slope matters little for walking.
• Climate factors (temperature, precipitation) are of “minimal importance” to annual active travel rates and should not be used as an excuse. [This point is challenged by audience.]
• Gasoline price: an increase of US $0.40/L is associated with a ~1.0 percentage point increase in walking and a ~0.5 percentage point increase in cycling.
• GDP per capita is associated with higher bicycle travel, though not significantly for walking.
5. Climate and Health Impacts
Climate potential: A “Copenhagen scenario” (44.3 km of bicycle facility per 100 km of road in every city) could cut global private-vehicle emissions by ~5.6%.
About 60% of the reduction comes from more walking.
Health benefits: Estimated at ~$435B per year from increased physical activity.
6. Policy Levers by local government
- Redesign streets to make active travel safer and more comfortable
- Increase densities by relaxing land-use regulations (long-term strategy)
- Put safety first: safety and quality of life drive infrastructure improvement
- Cost doesn’t need to be prohibitive; low-cost improvements are possible
- National policies like higher gasoline prices matter.
7. Look Beyond Famous Examples
Successful active travel is globally distributed:
• Walking: Europe: Slovakia, Serbia, and Belarus; Global South: Morocco and Lima, Peru
• Cycling: Suburbs of Osaka and Tokyo in Japan; Latin American, Bangladesh, and Morocco.
Less-heralded success stories offer context-appropriate models for cities to emulate.
• Osaka, Japan
A network of narrow, slow streets, different road users coexist safely.
Adding roadway-level bicycle lanes on arterials to improve travel speeds and reduce pedestrian-bike conflicts.
• London, UK
Ambitious planning: Cycle Action Plan, Pedestrian Comfort Guide
Institutional support: Walking and Cycling Commissioner
Cycleway network plus Low Traffic Neighbourhoods, restricting car while permeable for cyclists and pedestrians
• Montreal, Canada
All-year cycle network with snow plowing + Express Bicycle Network.
Strong political support for active travel and public transport, part of the mayor’s party platform
• Nairobi, Kenya
Protected bike lanes (rare in African cities) and a street design manual
Physical separation of pedestrians and cars, avoiding common scourges like sidewalk parking
• Leiden, Netherlands
“low-car city agenda” that restricts motor vehicles while allowing pedestrian and bicycle access in the city center.
The historic structure and thoughtful designs: canal-side street redesigns
• Buenos Aires, Argentina
307 km of protected bike lanes and improving pedestrian infrastructure (like shortened crossings)
Public realm signals pedestrians are not second-class
• Hoboken, USA
Complete Streets policy using low-cost tools, such as temporary cones, plastic posts, and intersection daylight. Vision Zero safety focus.
Prof. Kay Axhausen’s Comments
The comprehensive global dataset sets the foundation for data analysis across the world.
Suggested submitting the work to the data paper series at the journal Transportation as a formal reference for the rest of the world.
Promotion of cycling often results in recruiting “not car drivers,” but rather existing public transport users or walkers.
To “really solve the problem,” policymakers “really have to get people out of cars”.
Jinhua’s Dialog with Adam
Jinhua Zhao’s Question (J.Z.); Adam Millard-Ball’s Response (A.M.B.)
J.Z.: Can you clarify the relationship between bicyclists and pedestrians, especially concerning conflict, and how successful co-mingling (like in Osaka) is achieved?
A.M.B.: Conflict often arises due to “volumes and width,” especially exacerbated by high speed e-bikes.
In Osaka, co-mingling works on local streets where speeds are low.
Osaka is moving “towards designs where the bicycle lane is in the roadway” and physically separated to improve travel speeds and reduce pedestrian conflict.
J.Z.: What is the definition of a walking trip (e.g., distance buffer sensitivity), and how can researchers access the full Google Environmental Insights Explorer dataset?
A.M.B.: The analysis uses share of distance traveled (kilometers), which is less sensitive to short trip cutoffs (e.g., a 10-meter trip) than analyzing trip counts.
Multimodal access trips (like walking to a bus stop) are calculated by distance for that segment.
Full data access requires a “data licensing agreement” with Google, although public data is available for several hundred cities.
J.Z.: The study is associational. What does it take to move to a causal argument? More importantly, from the policy making viewpoint, when is causal analysis critical and when is associational analysis sufficient?
A.M.B.: Achieving causal inference globally is statistically challenging (e.g., instrumental variables often fail across diverse contexts).
Associational findings are sufficient because the causal mechanisms are already known from localized studies (e.g., bike lanes increase biking).
The study’s main value is demonstrating that these established associations hold true globally—in Latin America, Sub-Saharan Africa, and Southeast Asia—not just in Western cities.
J.Z.: Can planners help any given city identify a comparable “sister city” from the successful examples you found?
A.M.B.: Provide a “menu of options” and let cities choose their most relevant peers, recognizing that local context matters. Examples include suggesting Montreal or Hoboken for North American cities, or looking to less-heralded examples like Osaka.
J.Z.: What mode of persuasion works best for translating this research into political action? Do politicians care about the distinction between association and causation?
A.M.B.: The effective recipe involves building a “political constituency” of people who walk and bike and see the benefits.
A “virtuous circle” occurs when improved street designs make the benefits concrete.
Public opinion often flips to support the policy once implemented, similar to congestion pricing in Stockholm and New York.
Audience Comments and Questions (w/o specific attributions)
- Speed Differential Risk
Regulating differential speeds across two-wheelers (e-bikes vs. human-powered bicycles) is challenging and could lead to “tragic” outcomes.
Fast, quiet e-bikes present a danger to pedestrians.
High-speed bicycles should be removed from the bicycle category and classified under motorbike rules, prohibiting their use on bike and pedestrian lanes.
Speed and weight are the better markers than bike type, and proposed mandatory speed governors for ALL vehicles (including cars and bikes) in dense urban areas.
2. Chicken and egg debate
Promoting cycling without mandatory safety infrastructure (segregation) and transport safety technology (like London’s Direct Vision system) is “borderline irresponsible and reckless.”
London’s Direct Vision system on heavy goods vehicles: https://tfl.gov.uk/info-for/deliveries-in-london/delivering-safely/direct-vision-in-heavy-goods-vehicles
vs.
The benefits of biking vastly outweigh the risks even in dangerous areas, and that increased biking inherently “MAKES biking safer” (“safety in numbers”).
3. The Need for Car Disincentives (Sticks)
• Pricing and Parking: making active travel appealing must be paired with policies that involve “pricing driving (and parking) appropriately”. Particularly reducing parking.
• London congestion charge plays a dual role in mode shift by affecting user behavior and focusing planners’ attention.
London used the charge not to reduce congestion, but specifically to “free up space on the streets for buses and for pedestrian space”.
4. Climate Concerns and Urban Form:
Despite Millard-Ball’s global finding that climate is a minimal barrier, some attendees argued that extreme hot and humid conditions in places like India, the Middle East, and Southeast Asia act as a major barrier, especially during peak hours.
Solar-roofed bicycle tracks as a possible intervention in high-sunlight regions.
5. Accessibility:
Calls to prioritize facilities for “rolling” users (wheelchairs, seniors, strollers) over just bikes or pedestrians, reflecting the goal of designing for the “most difficult use case”.
The rapid introduction of new bike infrastructure often leads to conflicts regarding accessibility for the disabled community.
6. Enforcement: American cities often fail at Vision Zero because they “don’t enforce laws.”
Appendix:
Beyond Copenhagen: Walking & cycling success stories from cities worldwide (report)
Besides research at JTL, M3S and MMI, I have two passion projects:
- I help cities with transit, AV, and AI: pls join my Newsletter
- I help youth learn scientific research and build critical thinking Scientific Inquiry Mastery